Your Fleet's Statistics. Smarter. Simpler.

Fleet Statistics is a whole new way to monitor, analyze, and optimize your fleet from a single dashboard.

Fleet utilization overview bar with engine, cruising, and stationary time

ALL YOUR FLEET’S DATA TOGETHER

One View. Entire Fleet

See your entire fleet performance at a glance in one page. From fuel usage to travel time, the key metrics for vessel fleet monitoring are now just one glance away.

Fleet utilization overview bar with engine, cruising, and stationary time

Track Fuel and Efficiency

Fuel Smarter. Save More.

Monitor total and average fuel consumption across your fleet.

Understand usage patterns, reduce waste, and save on fuel costs, boost efficiency, trip after trip and contribute to smarter fleet optimization.

BOOK A 1:1 DEMO

Visualize Movement with the Heatmap

Where Your Fleet Operates is Visualized.

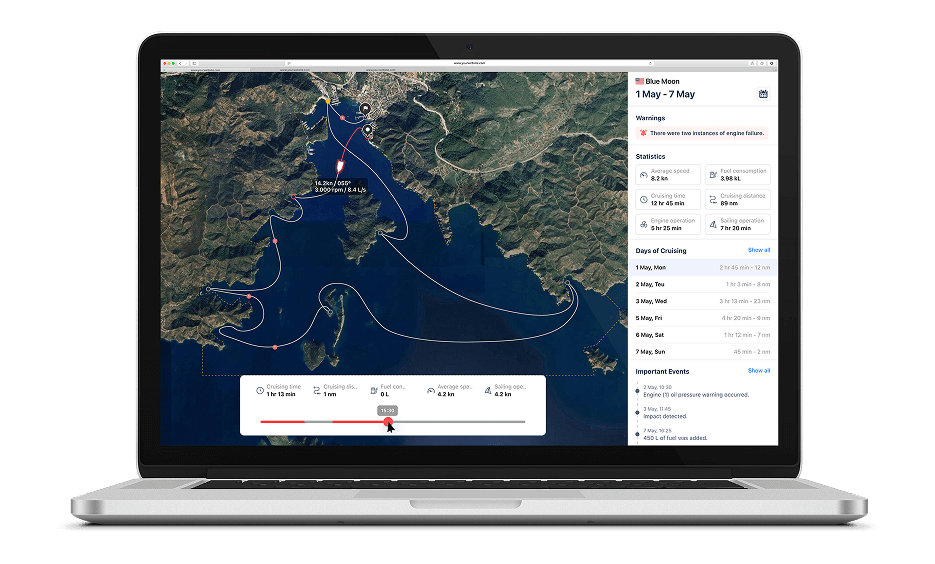
See the actual routes your boats take with a dynamic heatmap. Spot high-traffic areas, analyze idle time, and optimize for better efficiency.

The heatmap view turns complex fleet statistics into actionable insights.

Fleet Utilization Breakdown

From Overview to Granular Detail.

See individual boat stats and compare vessels side by side to improve operations and crew efficiency without leaving the page:

  • Engine Hours
  • Trip Analytics
  • Fuel Consumption
  • Speed and RPM Data
  • Total Distance

This is where fleet performance meets clarity and helps you pinpoint opportunities for fleet optimization.

Smarter Operations Start Here

Data-Driven Decisions, Made Simple.

Use filters to view daily, weekly, or monthly fleet statistics.

Compare periods. Identify patterns. Make informed decisions that reduce costs, improve fleet performance, and extend your fleet’s life.

Vanemar | App Preview

Ready to See Your Fleet Differently?

Let us show you how Fleet Statistics can simplify your operations, enhance vessel fleet monitoring, and save you money. Book a personalized 1:1 demo with our team today.

BOOK A 1:1 DEMO NOW